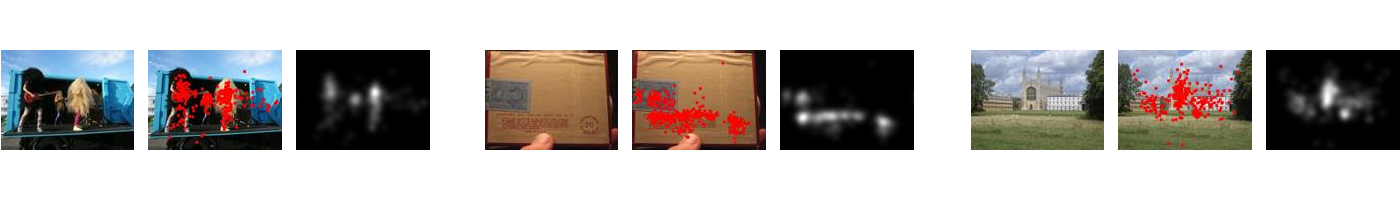
Many computational models of visual attention have been created from a wide variety of different approaches to predict where people look in images. Each model is usually introduced by demonstrating performances on new images, and it is hard to make immediate comparisons between models. To alleviate this problem, we propose to compare models on benchmark datasets with held-out human fixations. We calculate the performance of many models at predicting ground truth fixations using multiple metrics. We post the results here and provide a way for people to submit new models for evaluation. At this point, we provide 2 benchmark datasets: MIT300 and CAT2000.
MIT300 was introduced in January 2012. It is composed of 300 images, where the fixation data of 39 observers on each image has been held out.
View the results of models evaluated on 300 images (with fixations of 39 observers).
CAT2000 was introduced in January 2015. It is composed of 4000 images, split into 2000 train images and 2000 test images. For the test images, the fixation data of 24 observers on each image has been held out. For the train images, the fixation data of 16 observers is available, but 8 observers are held out.
View the results of models evaluated on 2000 test images (with fixations of 24 observers).
MIT Saliency Benchmark