MIT Saliency Benchmark
It's been good... The MIT Saliency Benchmark (EST. 2012) has transitioned hands.
The new benchmark can be found at https://saliency.tuebingen.ai.
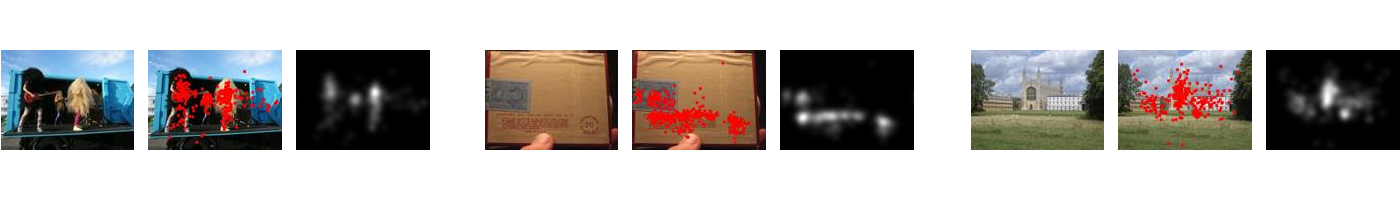
MIT300 was introduced in January 2012. It is composed of 300 images, where the fixation data of 39 observers on each image has been held out. When you send us your saliency maps for these 300 images, we compute the ability of your models to predict human fixations, according to multiple similarity metrics and we post the results here.
CAT2000 was introduced in February 2015. It is composed of 4000 images, split into 2000 train images and 2000 test images. For the test images, the fixation data of 24 observers on each image has been held out. For the train images, the fixation data of 18 observers is available, but 6 observers are held out. When you send us your saliency maps for the 2000 test images, we compute the ability of your models to predict human fixations, according to multiple similarity metrics and we post the results here. You can also send us your saliency maps for the 2000 train images to see how your models generalize.
CAT2000 was introduced in February 2015. It is composed of 4000 images, split into 2000 train images and 2000 test images. For the test images, the fixation data of 24 observers on each image has been held out. For the train images, the fixation data of 18 observers is available, but 6 observers are held out. When you send us your saliency maps for the 2000 test images, we compute the ability of your models to predict human fixations, according to multiple similarity metrics and we post the results here. You can also send us your saliency maps for the 2000 train images to see how your models generalize.